![[Experimental]](figures/lifecycle-experimental.svg)
Arguments
- result
A summarised result object.
- x
Column or estimate name that is used as x variable.
- y
Column or estimate name that is used as y variable
- facet
Variables to facet by, a formula can be provided to specify which variables should be used as rows and which ones as columns.
- colour
Columns to use to determine the colors.
Examples
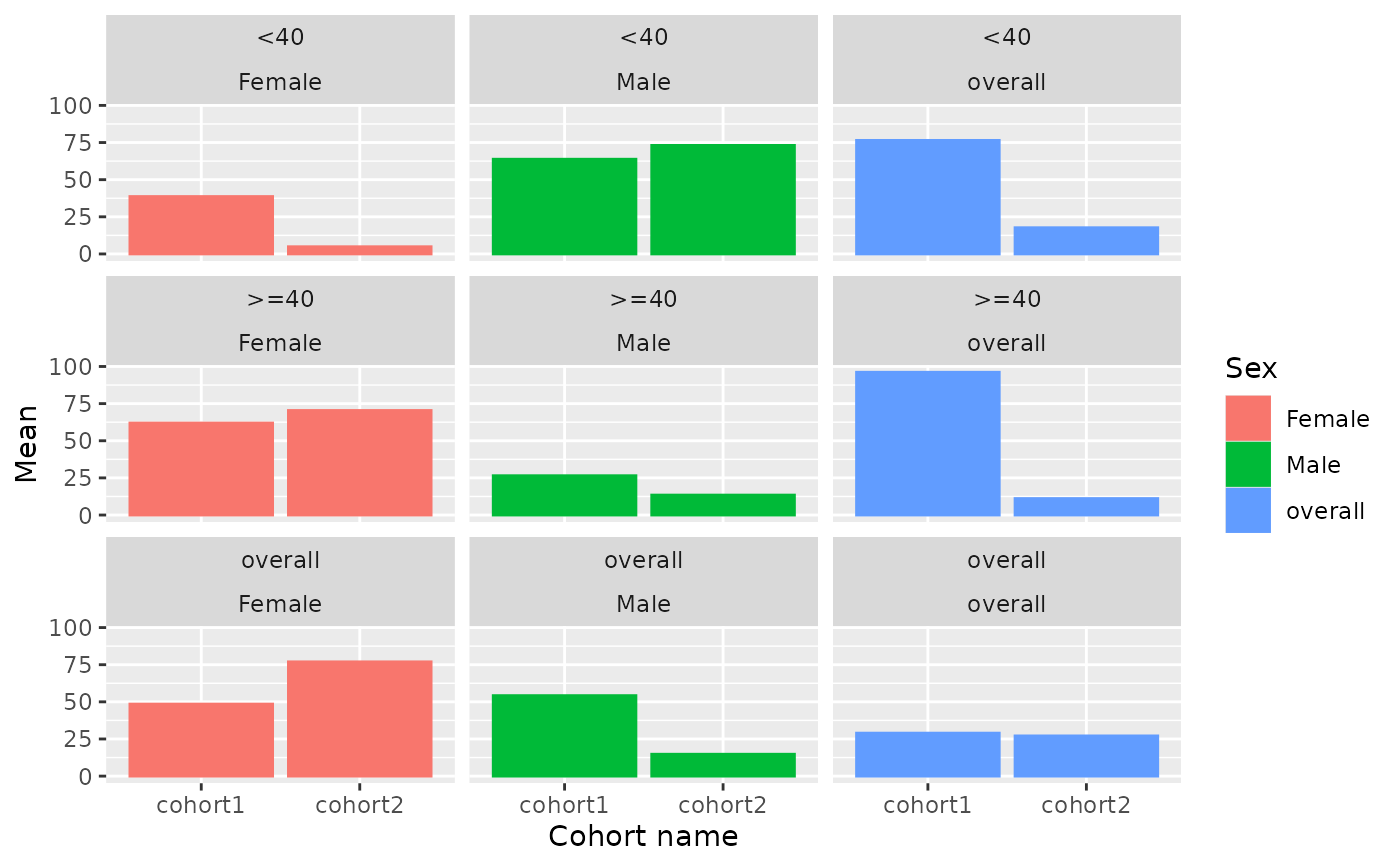
# \donttest{
result <- mockSummarisedResult() |> dplyr::filter(variable_name == "age")

plotBarplot(
  result = result,
  x = "cohort_name",
  y = "mean",
  facet = c("age_group", "sex"),
  colour = "sex")

# }
# }