Create a scatter plot visualisation from a summarised result object.
Source:R/plot.R
plotScatter.Rd![[Experimental]](figures/lifecycle-experimental.svg)
Usage
plotScatter(
  result,
  x,
  y,
  line,
  point,
  ribbon,
  ymin = NULL,
  ymax = NULL,
  facet = NULL,
  colour = NULL,
  group = colour
)
Arguments
- result
A summarised result object.
- x
Column or estimate name that is used as x variable.
- y
Column or estimate name that is used as y variable
- line
Whether to plot a line using
geom_line.- point
Whether to plot points using
geom_point.- ribbon
Whether to plot a ribbon using
geom_ribbon.- ymin
Lower limit of error bars, if provided is plot using
geom_errorbar.- ymax
Upper limit of error bars, if provided is plot using
geom_errorbar.- facet
Variables to facet by, a formula can be provided to specify which variables should be used as rows and which ones as columns.
- colour
Columns to use to determine the colors.
- group
Columns to use to determine the group.
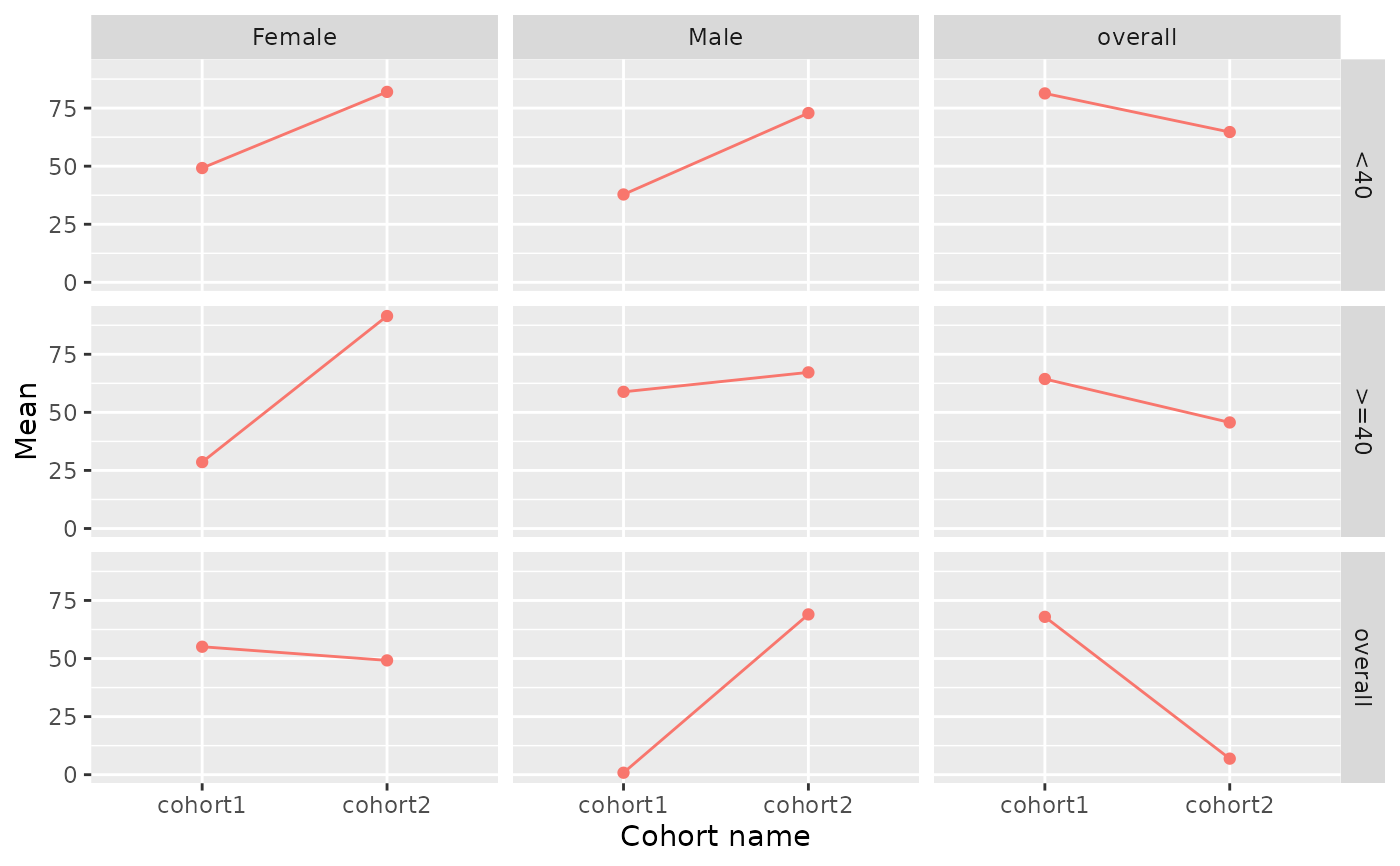
Examples
# \donttest{
result <- mockSummarisedResult() |>
  dplyr::filter(variable_name == "age")

plotScatter(
  result = result,
  x = "cohort_name",
  y = "mean",
  line = TRUE,
  point = TRUE,
  ribbon = FALSE,
  facet = age_group ~ sex)

# }
# }