Apply a pre-defined visOmopResults theme to a ggplot
Arguments
- style
Visual theme to apply. Character, or
NULL. If a character, this may be either the name of a built-in style (seeplotStyle()), or a path to a.ymlfile that defines a custom style. IfNULL, the function will use the explicit default style, unless a global style option is set (seesetGlobalPlotOptions()), or a_brand.ymlfile is present (in that order). Refer to the package vignette on styles to learn more.- fontsizeRef
An integer to use as reference when adjusting label fontsize.
Examples
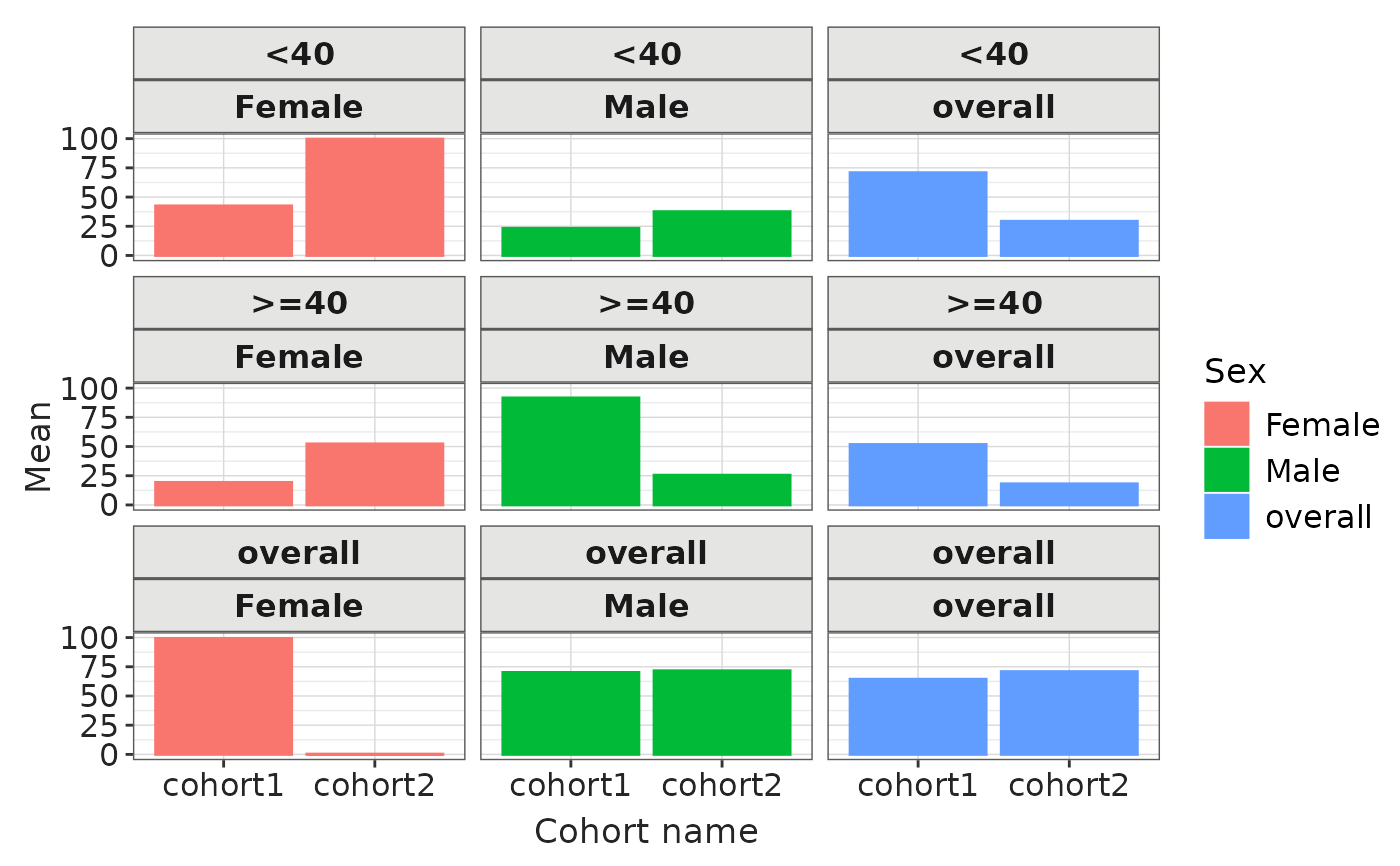
result <- mockSummarisedResult() |> dplyr::filter(variable_name == "age")

barPlot(
  result = result,
  x = "cohort_name",
  y = "mean",
  facet = c("age_group", "sex"),
  colour = "sex"
) +
  themeVisOmop()