Plot incidence results
Usage
plotIncidence(
  result,
  x = "incidence_start_date",
  y = "incidence_100000_pys",
  line = FALSE,
  point = TRUE,
  ribbon = FALSE,
  ymin = "incidence_100000_pys_95CI_lower",
  ymax = "incidence_100000_pys_95CI_upper",
  facet = NULL,
  colour = NULL
)
Arguments
- result
Incidence results
- x
Variable to plot on x axis
- y
Variable to plot on y axis.
- line
Whether to plot a line using
geom_line- point
Whether to plot points using
geom_point- ribbon
Whether to plot a ribbon using
geom_ribbon- ymin
Lower limit of error bars, if provided is plot using
geom_errorbar- ymax
Upper limit of error bars, if provided is plot using
geom_errorbar- facet
Variables to use for facets. To see available variables for facetting use the function
availableIncidenceGrouping().- colour
Variables to use for colours. To see available variables for colouring use the function
availableIncidenceGrouping().
Examples
# \donttest{
cdm <- mockIncidencePrevalence(sampleSize = 1000)
cdm <- generateDenominatorCohortSet(
cdm = cdm, name = "denominator",
cohortDateRange = c(as.Date("2008-01-01"), as.Date("2018-01-01"))
)
#> ℹ Creating denominator cohorts
#> ✔ Cohorts created in 0 min and 2 sec
inc <- estimateIncidence(
cdm = cdm,
denominatorTable = "denominator",
outcomeTable = "outcome"
)
#> ℹ Getting incidence for analysis 1 of 1
#> ✔ Overall time taken: 0 mins and 1 secs
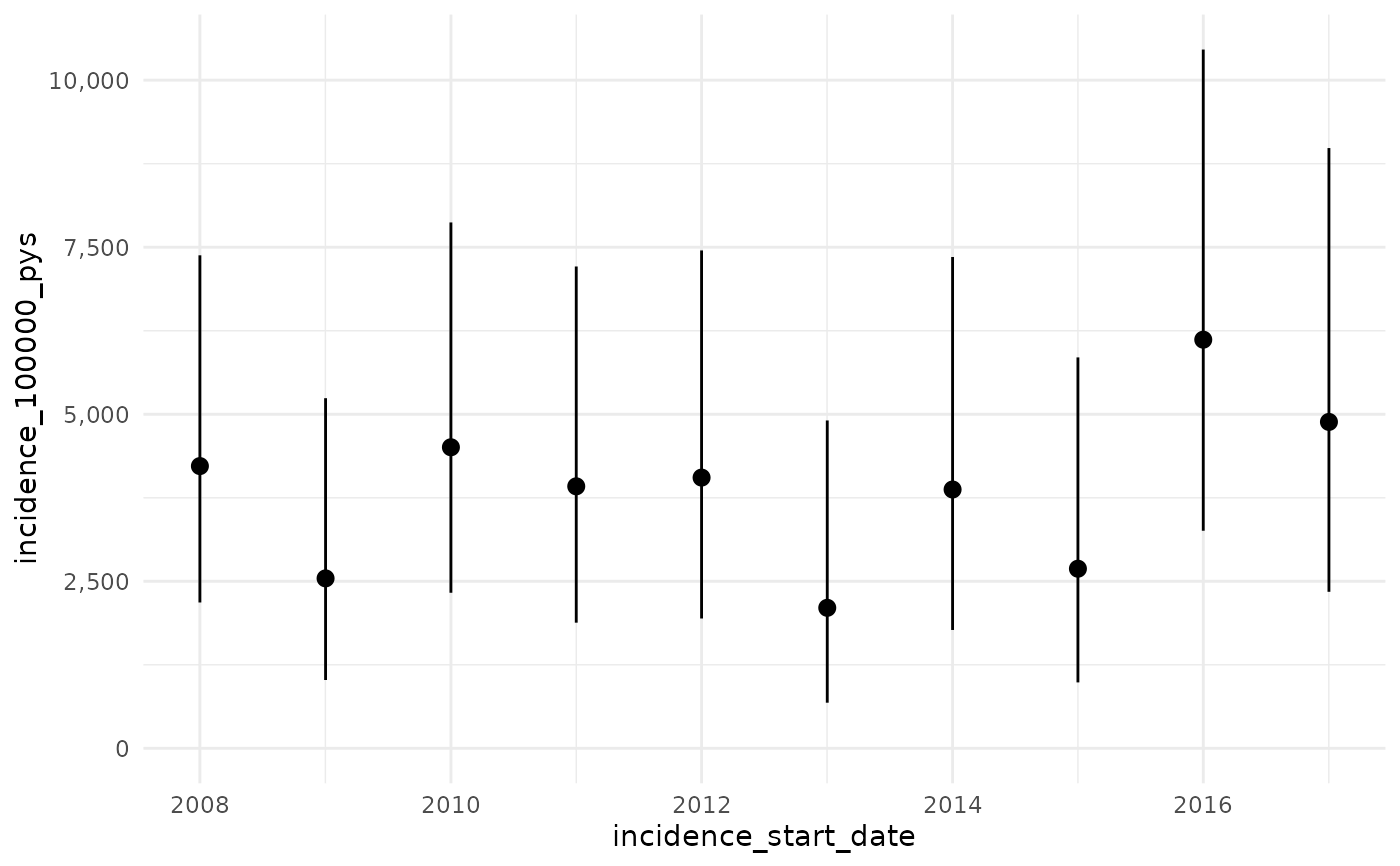
plotIncidence(inc)
 # }
# }